

Overview
Total populationMoM125132,149people
HouseholdsMoM5468,948households
Average ageMoMNo change49.8yrs
Sex ratioMale66,636peopleFemale65,513people50.4%49.6%
Area insights
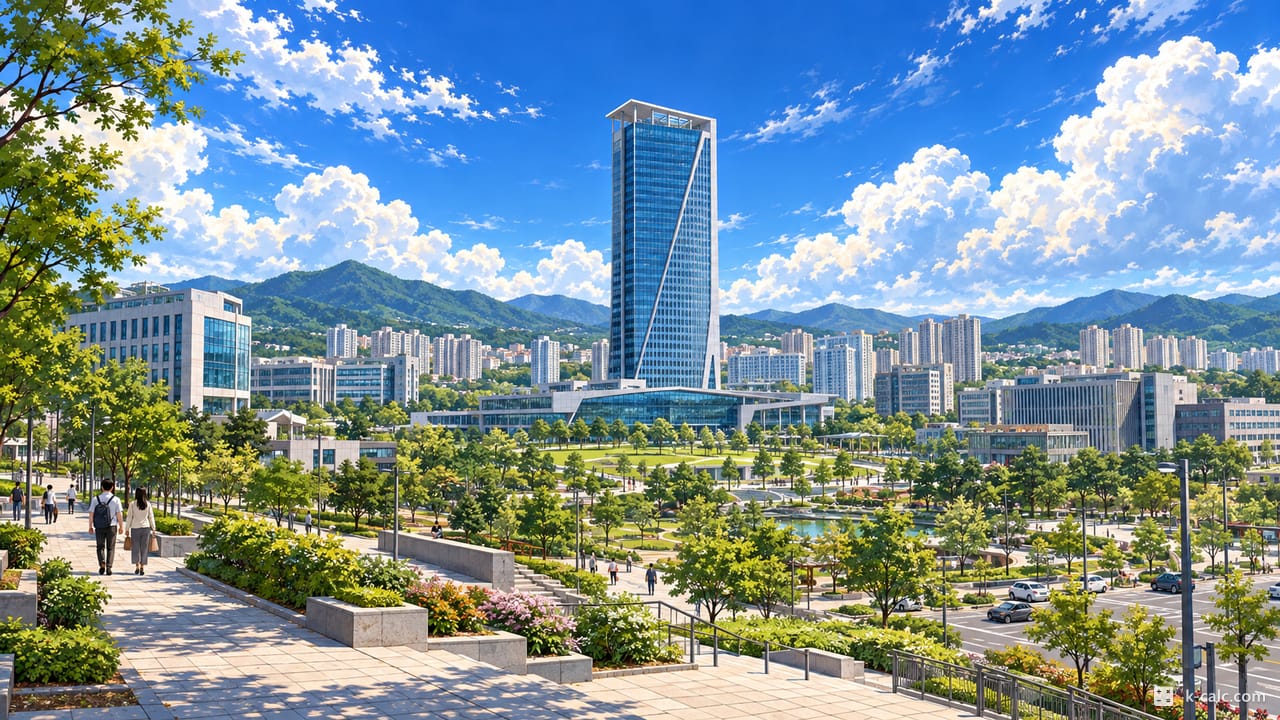
As of October 2026West Gyeongbuk transit hub with Jikjisa and Gimcheon Innovation City
Over the past 12 months, 1,352 more people moved out than in, the 3rd highest net outflow per resident among the 22 cities and counties of Gyeongsangbuk-do.
The population has shrunk 4 years in a row, from 139,477 to 132,149.
Areas with a similar population mix
Statistics
Change over time
4-year trendUnit: people
139,477 in 2022132,149 in 2026
Down 5.3% over the past 4 years.
Migration
As of September 2026Monthly Overview
Moved in817people
Moved out921people
Net migration−104people
Net migration by month
Unit: people
Net inflowNet outflow
Top origins
Unit: people
| Region | Moved in |
|---|---|
| Gumi-si | 64 |
| Sangju-si | 23 |
| Suseong-gu, Daegu | 14 |
| Dalseo-gu, Daegu | 13 |
| Dong-gu, Daegu | 11 |
Top destinations
Unit: people
| Region | Moved out |
|---|---|
| Gumi-si | 103 |
| Buk-gu, Daegu | 22 |
| Suseong-gu, Daegu | 16 |
| Dalseo-gu, Daegu | 15 |
| Chilgok-gun | 15 |
Outflows exceeded inflows in 11 of the past 12 months, for a net loss of 1,352.

Population structure
As of October 2026Unit: people
Male 66,636Female 65,513
Age structure
Unit: %
Youth 9.7%Working age 60.3%Seniors 30.0%
60s is the largest group, at 24,827 people.
Population ranking
Population by region
As of October 2026- YoungestYulgok-dong35.1 yrs
- OldestGuseong-myeon65.5 yrs
| Region | Share | ||
|---|---|---|---|
| Yulgok-dong | 23,512 | 17.8% | 35.1 yrs |
| Bugok-dong | 18,353 | 13.9% | 46.4 yrs |
| Sineum-dong | 14,782 | 11.2% | 45.4 yrs |
| Apo-eup | 7,756 | 5.9% | 55.2 yrs |
| Deokgok-dong | 6,132 | 4.6% | 44.7 yrs |
| Pyeonghwa-dong | 5,037 | 3.8% | 55.4 yrs |
| Jijwa-dong | 4,105 | 3.1% | 50.5 yrs |
| Eomo-myeon | 3,896 | 2.9% | 58.2 yrs |
| Daehang-myeon | 3,046 | 2.3% | 60.1 yrs |
| Nongso-myeon | 3,001 | 2.3% | 57.6 yrs |
| Gammun-myeon | 2,952 | 2.2% | 64.6 yrs |
| Nam-myeon | 2,861 | 2.2% | 60.9 yrs |
| Gyo-dong | 2,844 | 2.2% | 44.7 yrs |
| Bongsan-myeon | 2,748 | 2.1% | 60.7 yrs |
| Samnak-dong | 2,694 | 2% | 40.7 yrs |
| Hwanggeum-dong | 2,541 | 1.9% | 59.7 yrs |
| Moam-dong | 2,518 | 1.9% | 54.7 yrs |
| Guseong-myeon | 2,506 | 1.9% | 65.5 yrs |
| Gaeryeong-myeon | 2,152 | 1.6% | 61.9 yrs |
| Seongnae-dong | 2,029 | 1.5% | 58.6 yrs |
| Daedeok-myeon | 2,010 | 1.5% | 58.9 yrs |
| Joma-myeon | 1,968 | 1.5% | 62.6 yrs |
| Gamcheon-myeon | 1,648 | 1.2% | 61.6 yrs |
| Namsan-dong | 1,574 | 1.2% | 59.1 yrs |
| Eungmyeong-dong | 1,384 | 1% | 43.7 yrs |
| Jirye-myeon | 1,364 | 1% | 64.3 yrs |
| Buhang-myeon | 1,160 | 0.9% | 64.4 yrs |
| Dasu-dong | 991 | 0.7% | 56.1 yrs |
| Jeungsan-myeon | 938 | 0.7% | 64.5 yrs |
| Baegok-dong | 832 | 0.6% | 55.7 yrs |
| Yangcheon-dong | 725 | 0.5% | 60.6 yrs |
| Daegwang-dong | 684 | 0.5% | 57.9 yrs |
| Yongdu-dong | 676 | 0.5% | 59.3 yrs |
| Mundang-dong | 379 | 0.3% | 60.5 yrs |
| Gamho-dong | 351 | 0.3% | 63.3 yrs |
The top three areas hold 42.9% of the population of Gimcheon-si, Gyeongsangbuk-do.
Frequently asked questions❓
Gimcheon-si, Gyeongsangbuk-do has 132,149 residents as of October 2026., 2,098 fewer than a year earlier.
Yulgok-dong, home to 23,512 residents (17.8% of Gimcheon-si, Gyeongsangbuk-do).
It is 49.8 as of October 2026., 4 years above the national average of 45.8. Among its neighborhoods, Yulgok-dong is youngest at 35.1 and Guseong-myeon oldest at 65.5.
It fell 5.3% over 4 years, from 139,477 in 2022 to 132,149 in October 2026.
As of September 2026, the most people moved in from Gumi-si (64) and the most moved out to Gumi-si (103). Outflows exceeded inflows in 11 of the past 12 months, for a net loss of 1,352.
This is resident registration data from Korea's Ministry of the Interior and Safety. Figures are as of the end of October 2026 and are updated monthly. The data is open under KOGL Type 1.
Resident registration counts people at their registered address. The census counts them where they actually live. The gap is widest in university towns and industrial areas, where many people never change their registered address.
Sources 🌐
- Resident registration data, Ministry of the Interior and SafetyKOGL Type 1 · as of October 2026 · updated monthly
- Internal Migration Statistics, Statistics Korea (KOSIS)KOGL Type 1 · as of September 2026 · updated monthly